Frequency Analysis
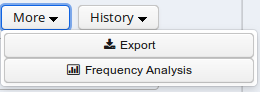
To perform a frequency analysis, enter the query whose results you want to analyze as usual in the AQL box. Note that you do not need to carry out the query first. Next, open the menu “More” between the Search and History buttons and select “Frequency Analysis”:
The interface will open the frequency analysis tab shown below. Initially, rows will be generated for the nodes present in the query. For example, two rows are automatically generated for the following query, which finds any pair of consecutive tokens:
tok . tok
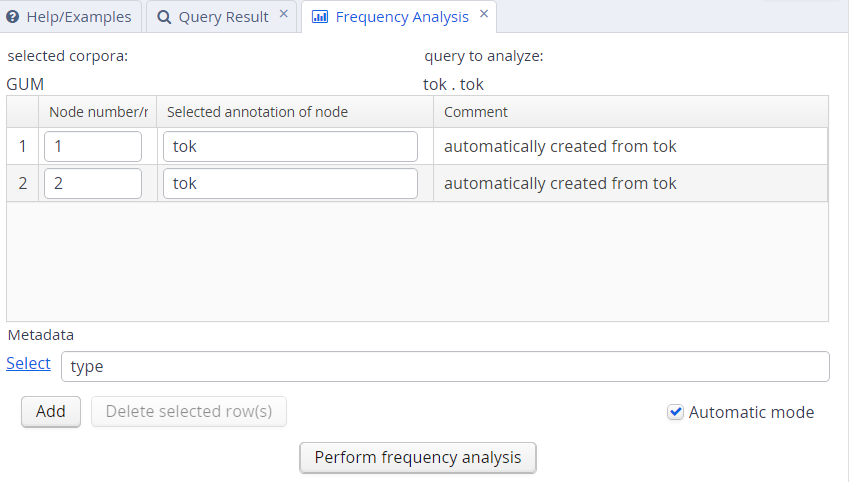
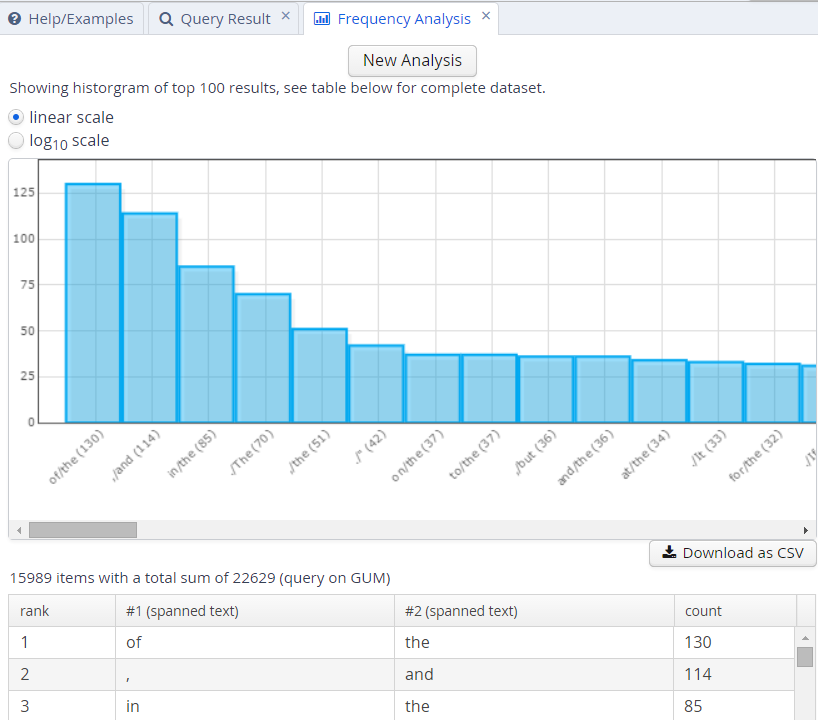
You may also add metadata to the frequency breakdown from the metadata selection link. Clicking on “Perform frequency analysis” will produce a breakdown of all consecutive token bigrams in the corpus. The frequency graph will only show the first 500 elements, but the table below it will give the entire list of values, which can also be exported as a CSV file.
To edit the analysis or analyze a new query, click the New Analysis button. It is also possible to add annotations to the analysis that were not in the original query, provided that these are expected to belong to some other node in the query. For example, the tokens in the GUM corpus also have part-of-speech and lemma information. We can replace the lines in the analysis specifying that tok values should be counted with pos values, which gives us part-of-speech bigrams. We can also add a lemma annotation belonging to the first search element, by clicking the Add button and entering the node definition number and annotation name we are interested in:
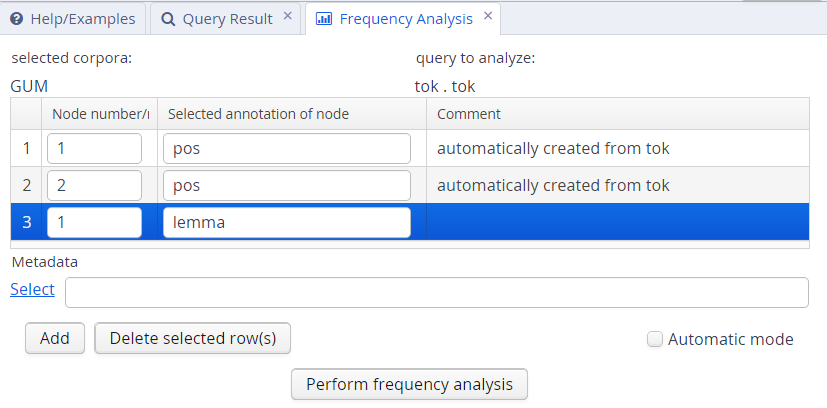
As a result, we will get a count for each combination of values grouped by the first and second tokens' parts-of-speech, as well as the first token's lemma.